Stores & Success Metrics 2023: How to Compete for Share of Wallet Given Industry Consolidation and Asset Concentration Insight Module

Order Report - Stores & Success Metrics 2023: How to Compete for Share of Wallet Given Industry Consolidation and Asset Concentration Insight Module
Report Overview
This report analyzes retail financial services firms across a variety of metrics including share of wallet (SOW), customer trust, intent to recommend and intent to invest more. The report identifies industry market leaders on these and other metrics. For example:
- Overall, industry average SOW at the national level is 38%, down from 42% in 2020
- On average SOW across all customers, Morgan Stanley is #1 with 55%, Edward Jones is #2 with 51% and Fidelity is #3 with 50%.
- Bank of America Merrill NET reaches 24% of U.S. households with saving and investing relationships, more than any other firm.
- Fidelity is No. 1 in reach with millionaire households, having relationships with 38% of them.
- Bank of America leads in integration of banking and investing, with 26% of its customers having investment accounts
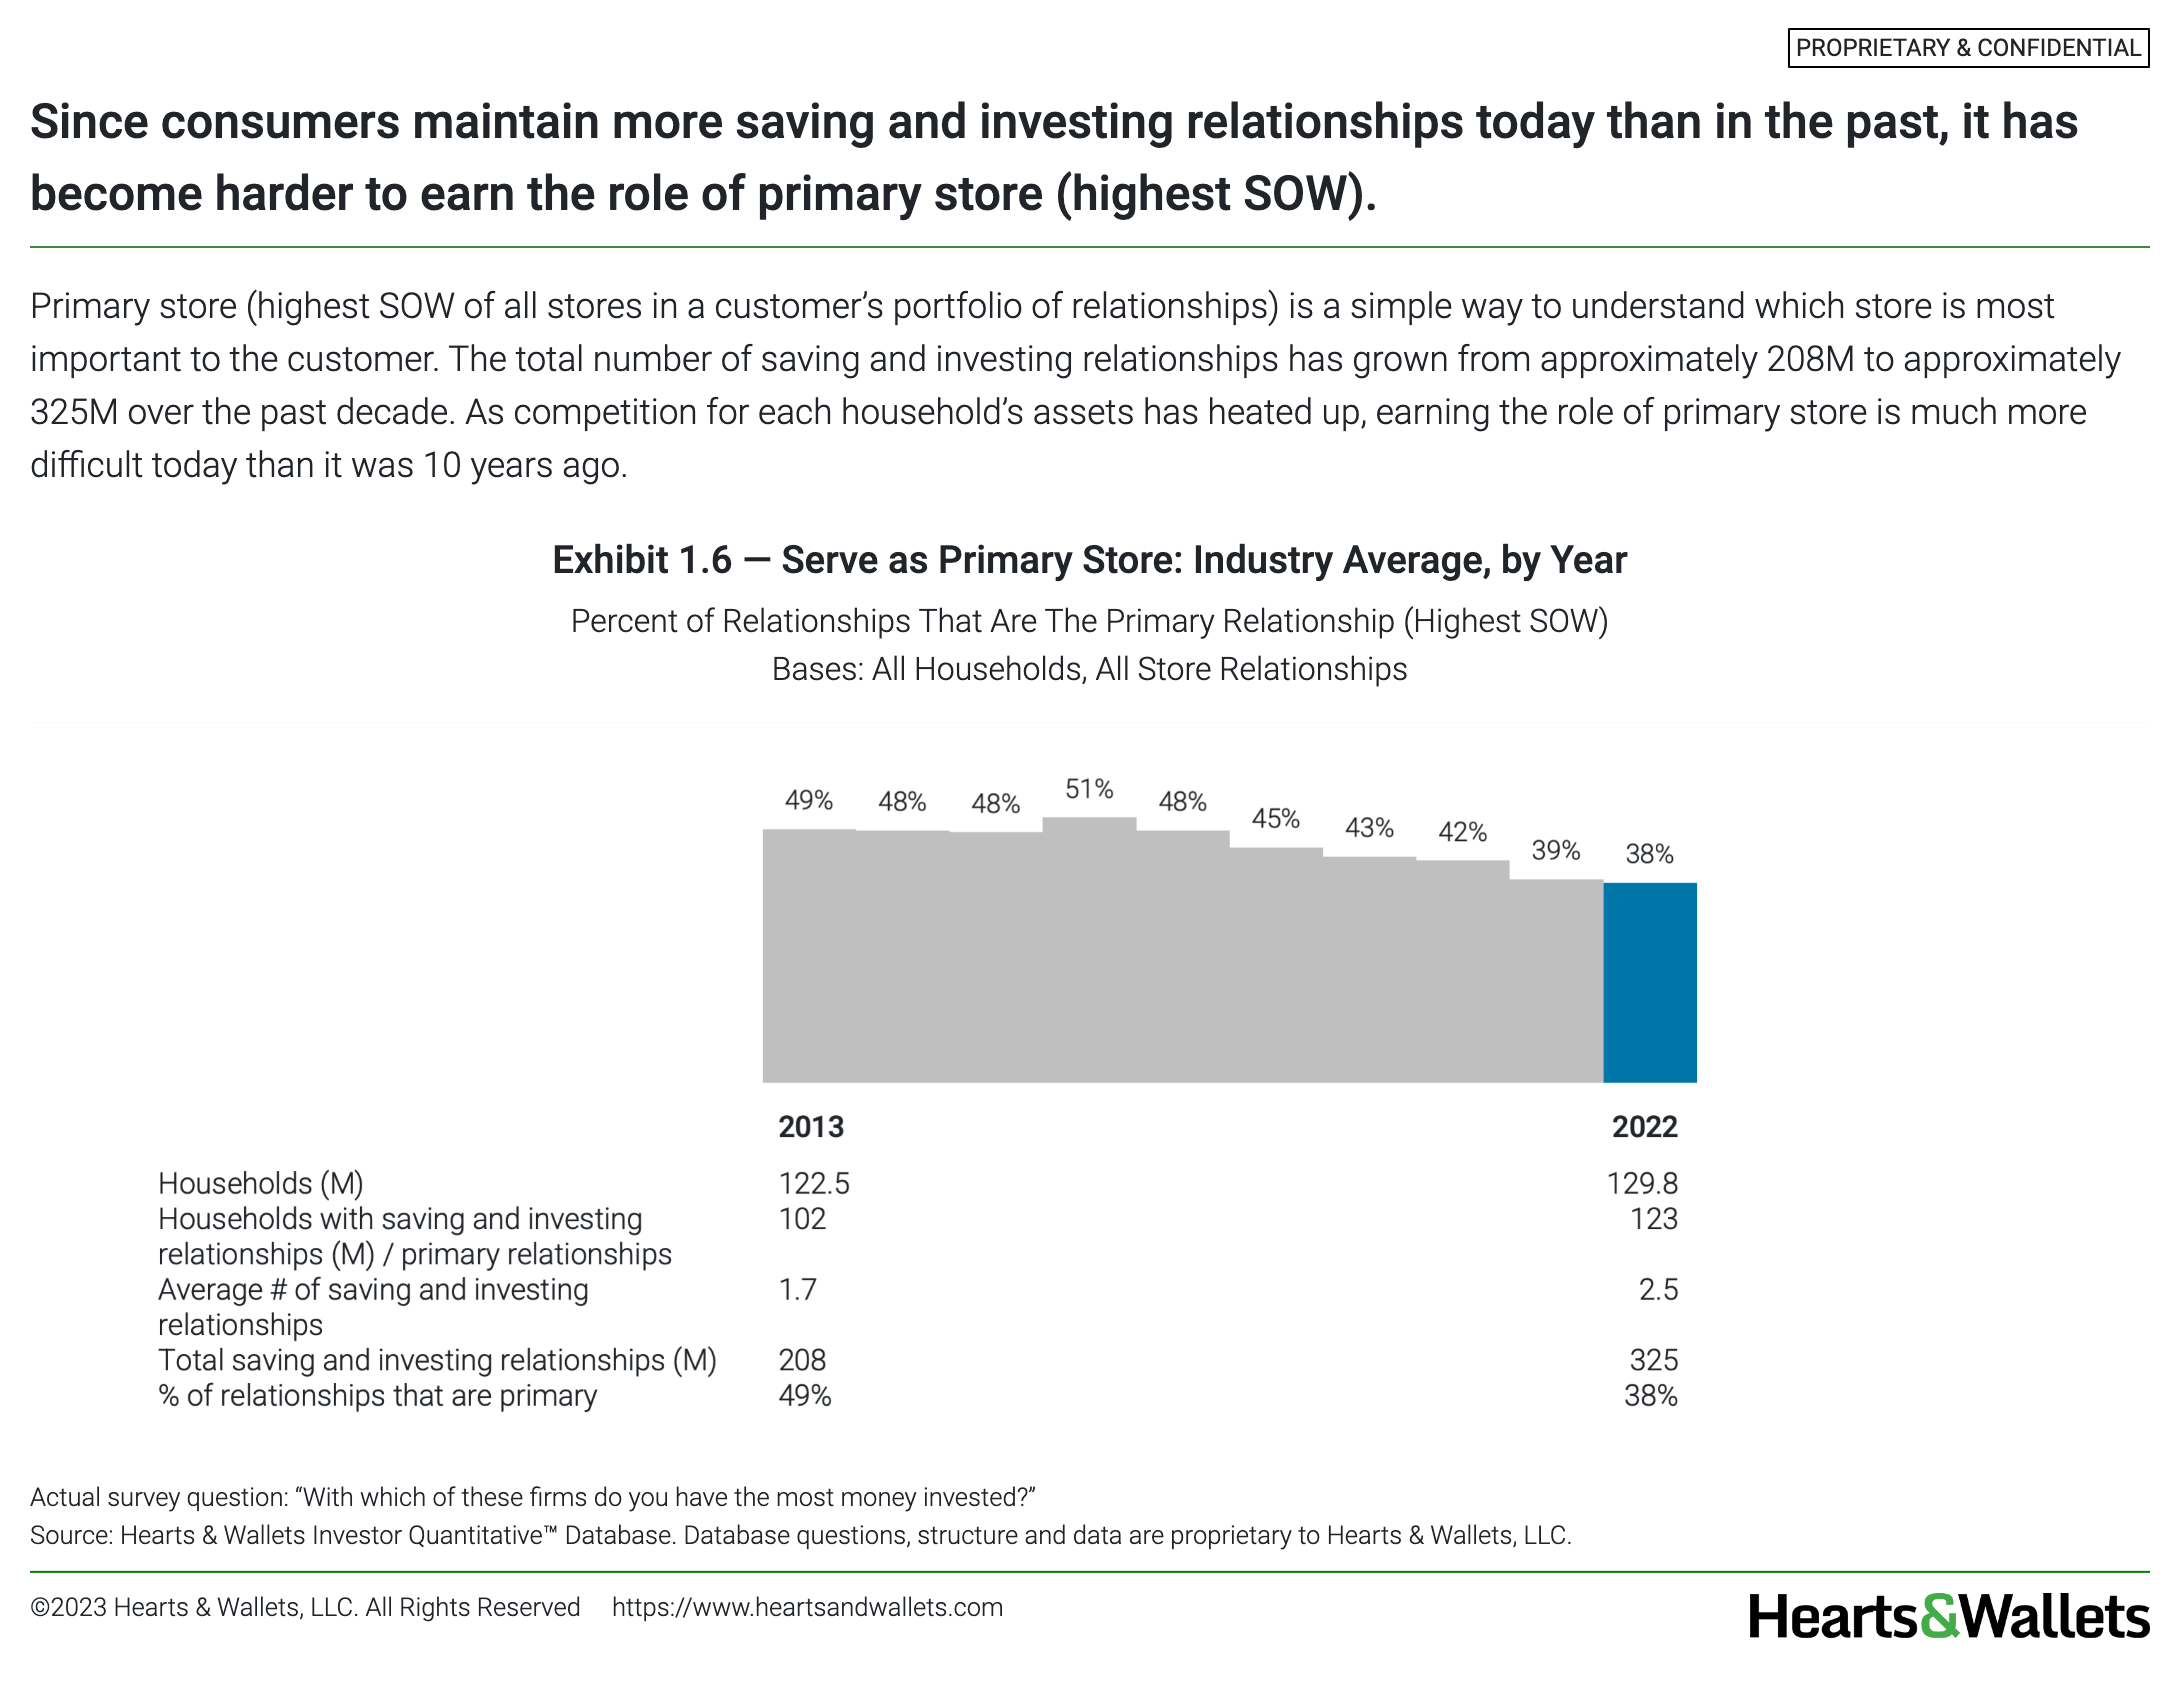
Additionally, the increasing number of relationships household have with financial service providers, makes it more difficult for firms to achieve high SOW. The average household has 2.5 saving and investing relationships, up from 1.4 relationships in 2012. And the average $1-million-plus household has 3.6 saving and investing relationships, up from 2.8 in 2012. The report looks at two ways to increase SOW - serving as the main source of retirement advice (MSRA) and delivering a combination of service and advice to customers.
Key Findings
- As more consumers have more saving and investing relationships than ever before, competition for the consumer wallet (SOW), especially among affluent households, is intensifying.
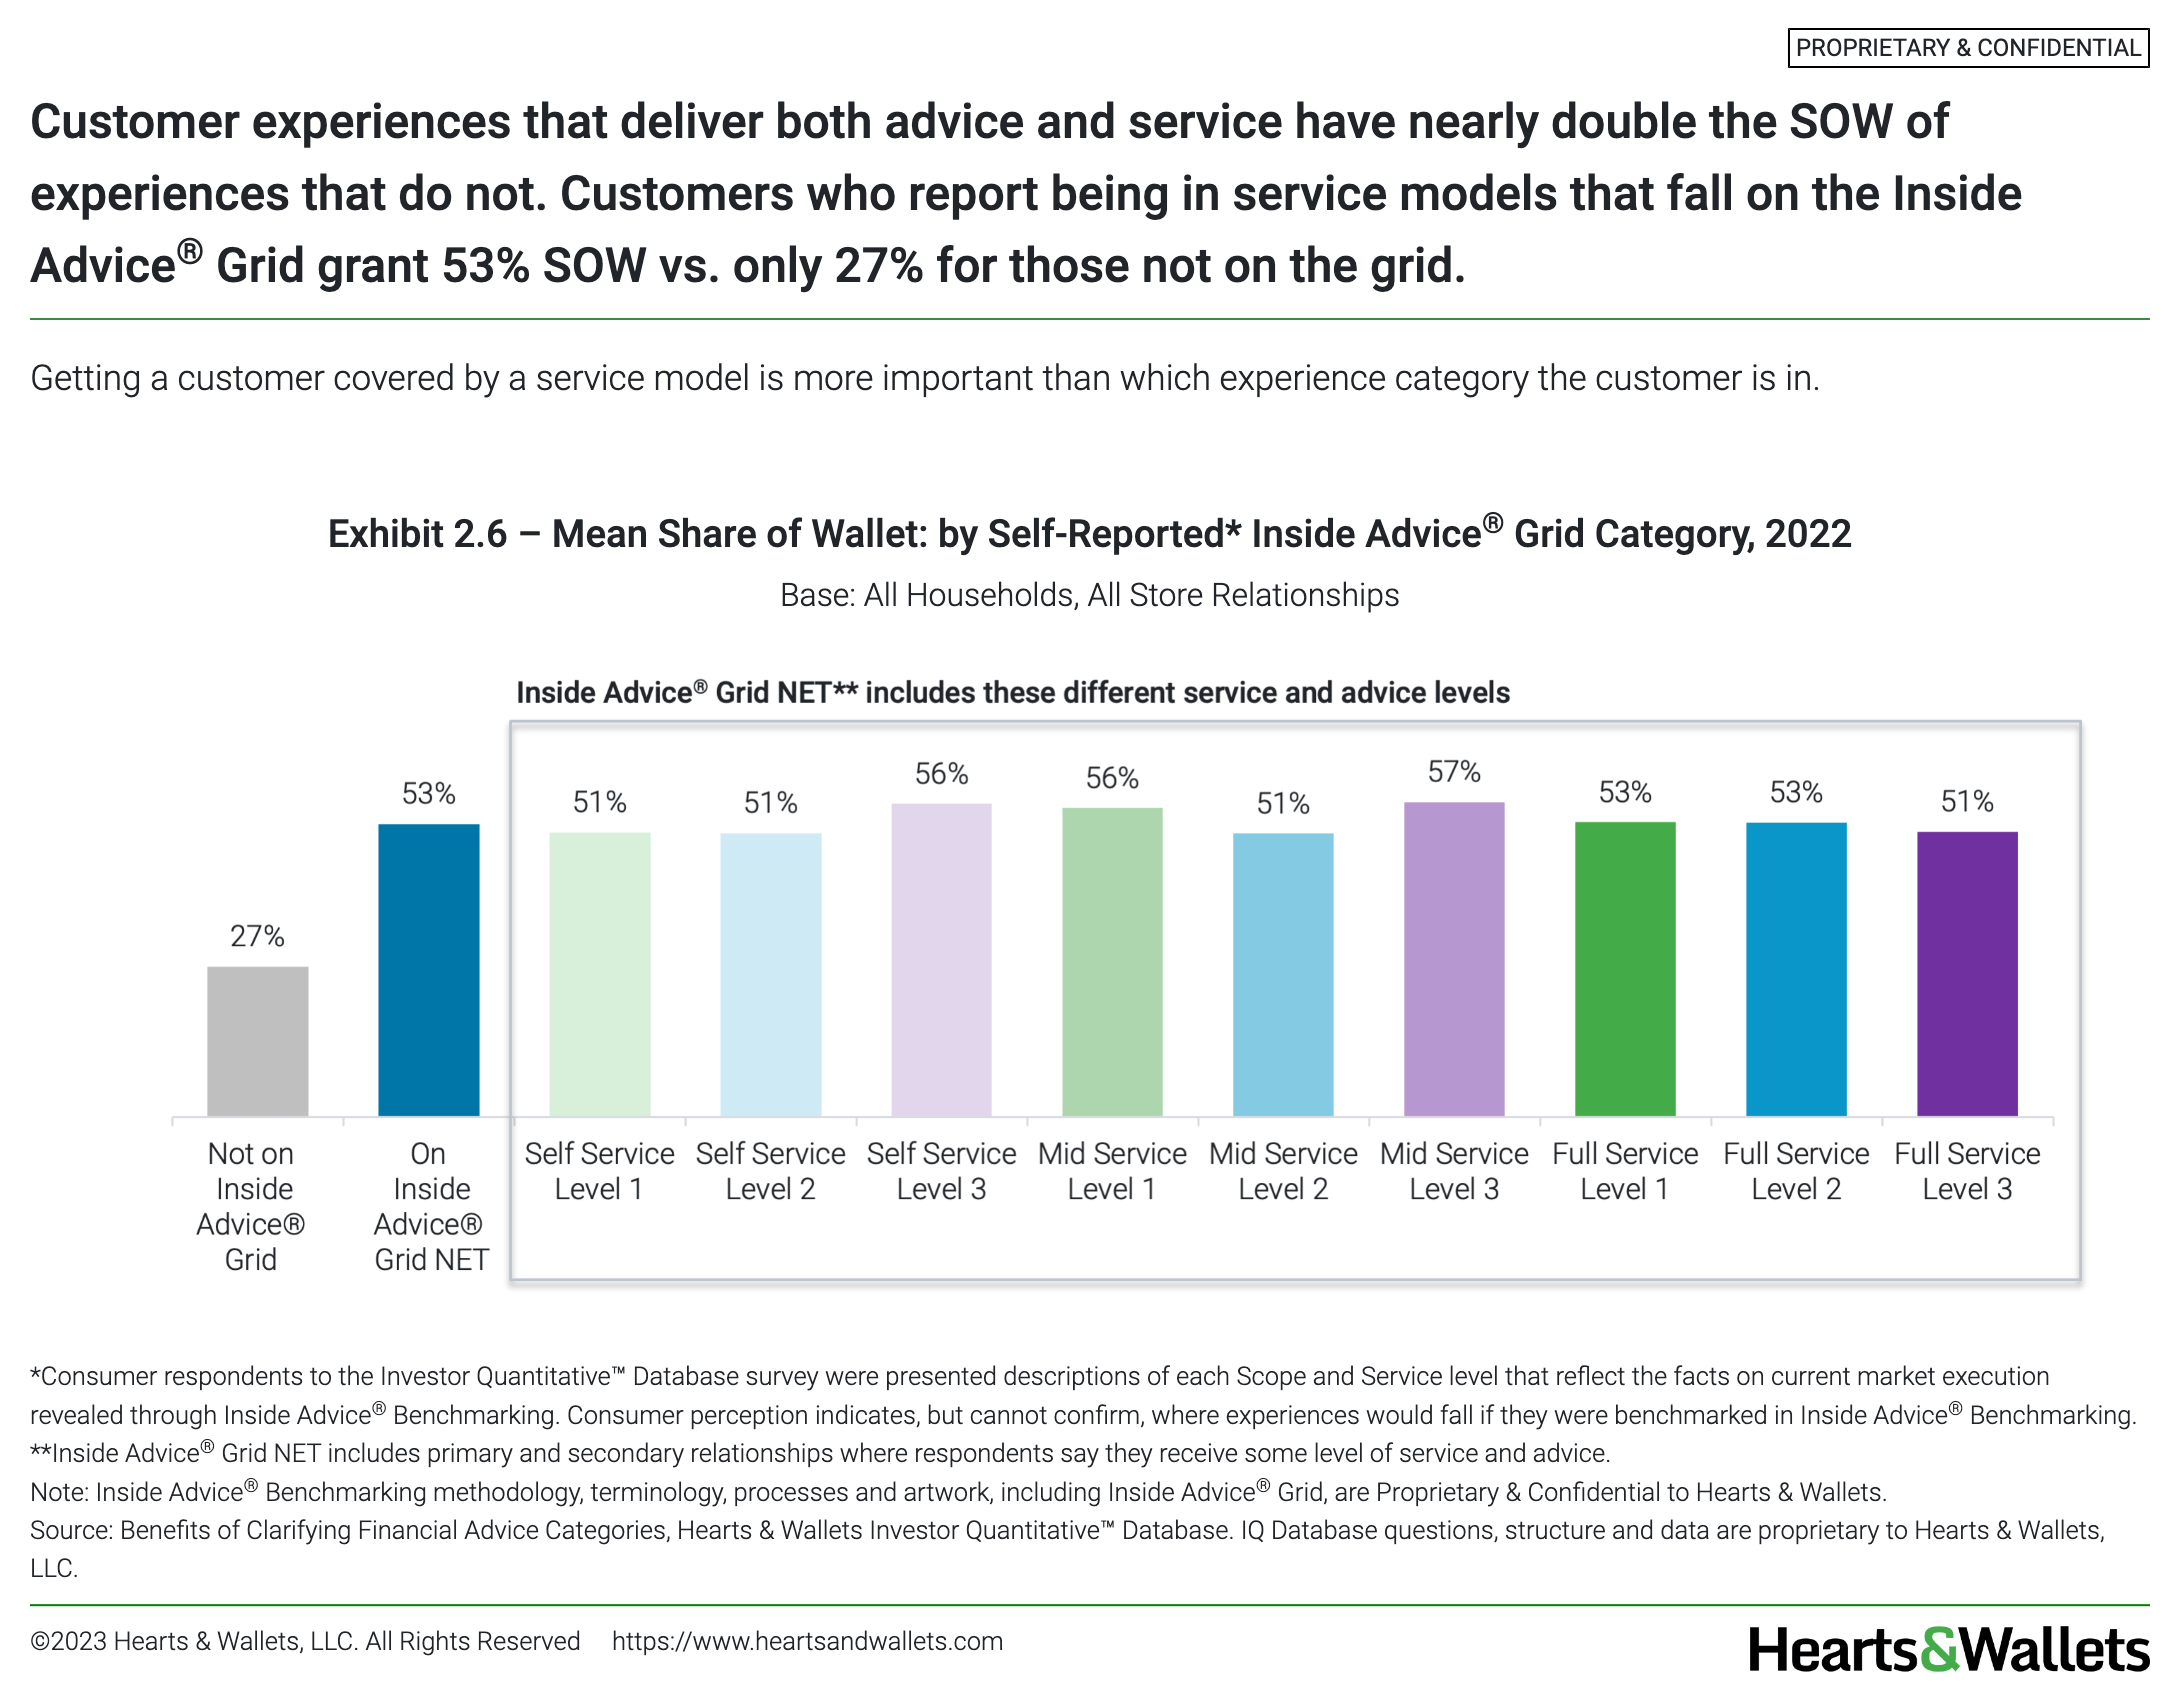
- The increasing number of relationships makes it harder to achieve high share of wallet (SOW). Two ways to increase SOW are becoming the Main Source of Retirement Advice (MSRA) and ensuring customers receive some coverage of service and advice.
- Bank of America Merrill NET is #1 in reach into U.S. households with Fidelity and JPMorgan Chase gaining. Fidelity is #1 in both reach and asset share with millionaires, due to diversified customer experiences.
- Both high trust and high likelihood to recommend slipped year over year. High likelihood to invest more fell at the national level, and precipitously so for households $1M+.
- The more account types a firm has, the more opportunities that exist to build relationships with its customers. An analysis by account type reveals firms that excel at cross-selling and penetration for certain offerings.
Pricing Options
Choose access licenses for your team or organization in ways that support how you collaborate. AVAILABLE FOR LICENSE TO NON TRENDS SUBSCRIBERS November, 2023.
Online only (1-20 log-ins) - $6,000
Online with slide download (1-50 logs-ins) - $9,500
Online with slide download, PPT & PDF (unlimited log-ins) - $15,000
Sample Report Pages