Portrait™ of U.S. Household Wealth 2023: The Foundation of Market Sizing Reveals the 55+ Opportunity and Wealth Market Targets

Order Report - Portrait™ of U.S. Household Wealth 2023: The Foundation of Market Sizing Reveals the 55+ Opportunity and Wealth Market Targets
Report Overview
The 2023 Portrait™ of U.S. Household Wealth reports on the current breakdown of household wealth in America. This report is updated annually. Learn who controls the wealth by age and asset ranges through the Portrait Grid™.
Key Findings
- Nearly 130M households control $69.7T in investable assets, with growth in taxable now faster than retirement due to increasing concentration of wealth.
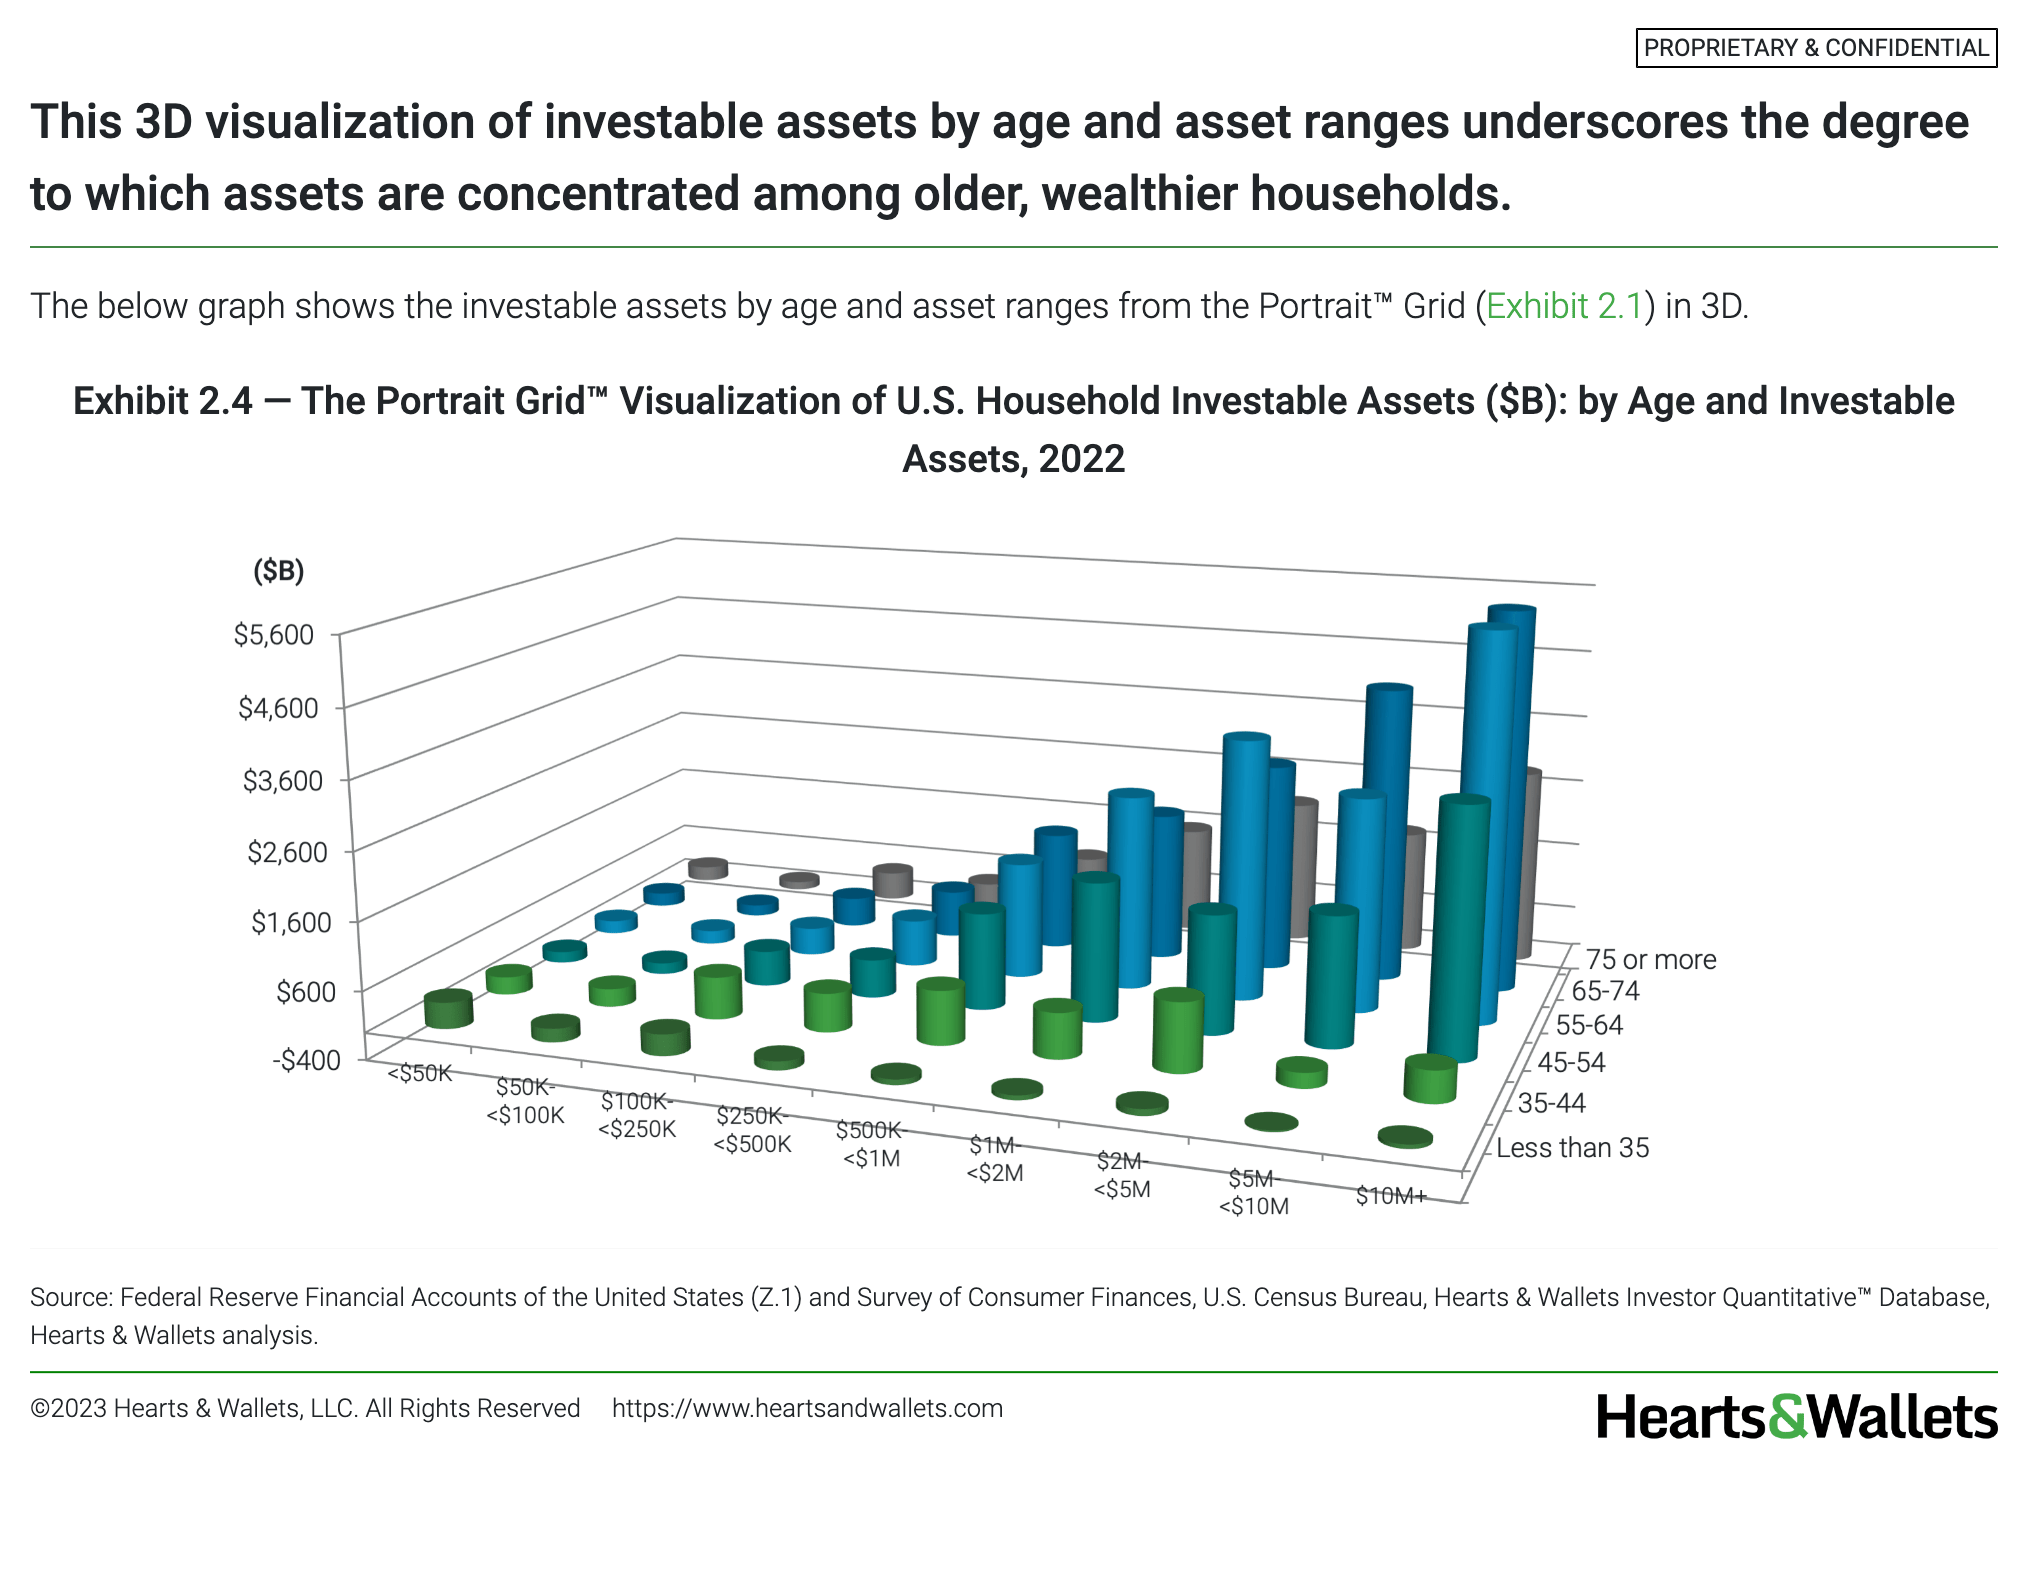
- Concentration of investable assets is increasing. In 2022, only 12% of total investable assets is controlled by households with <$500K, down from 23% in 2011.
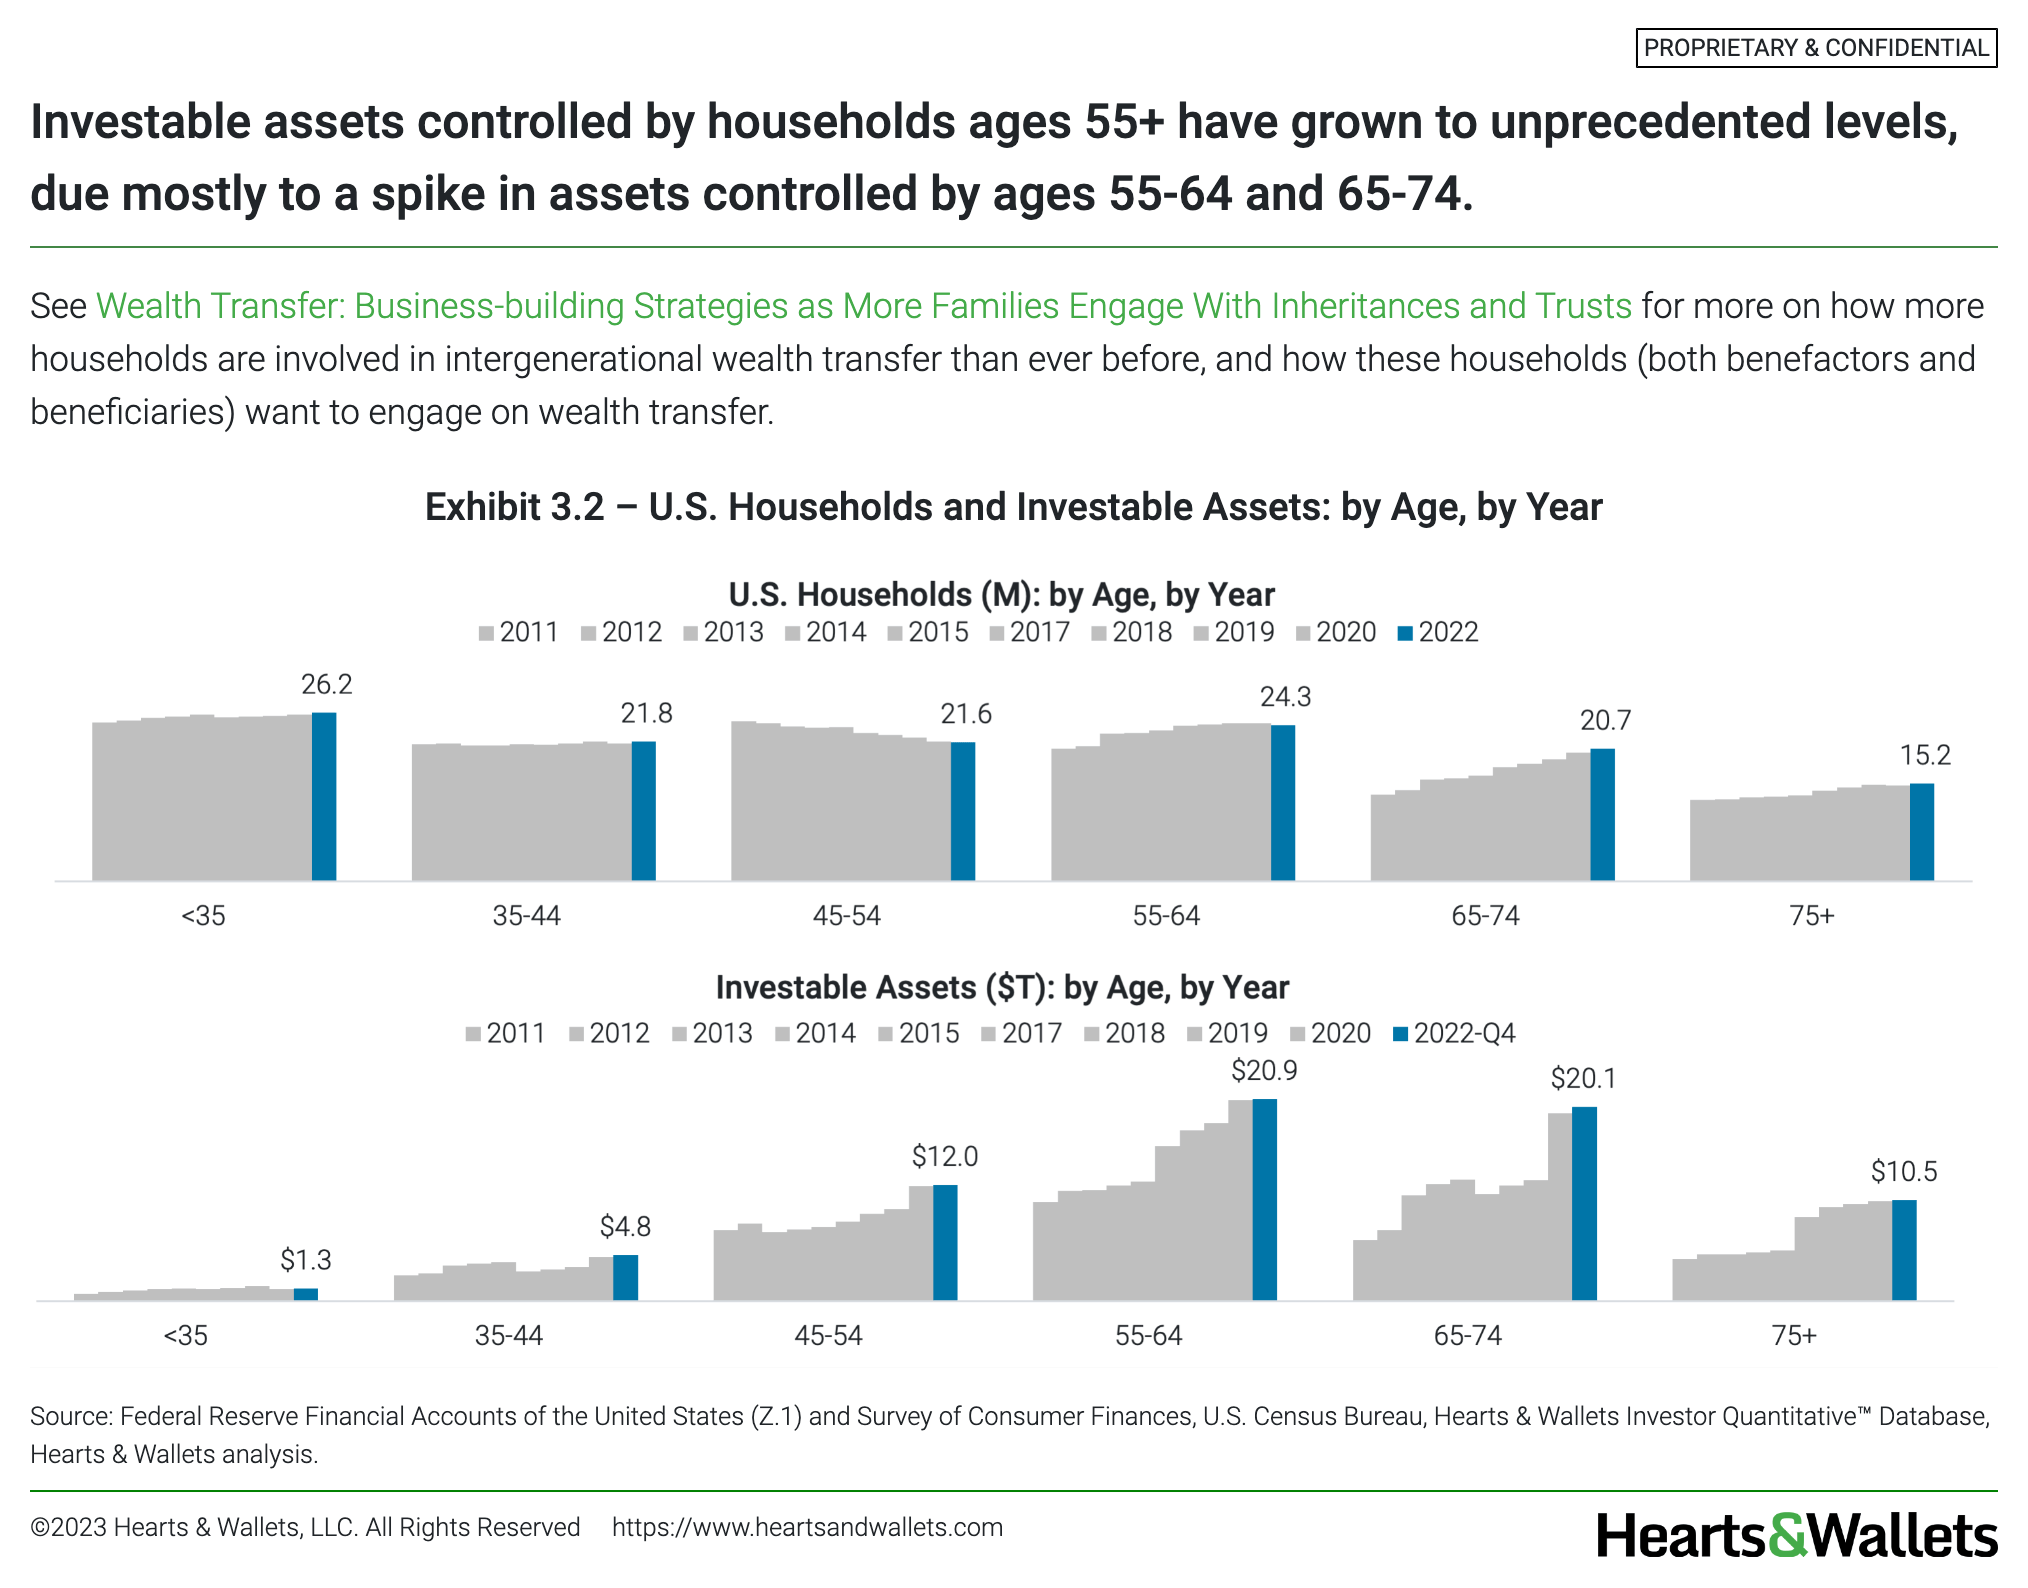
- Households age 55+ control $51.4T, in part due to increasing concentration of wealth. However, among households with <$5M, Post-Retirees still dwarf all other lifestages in both asset and household terms.
- The Wealth Market $2M+ of 5.5M households with $45.3T can be understood in 3 segments ($2M-<$5M Retired, $2M-<$5M Not Retired, $5M+) with differing attitudes and behaviors.
Pricing
Choose access licenses for your team or organization in ways that support how you collaborate. AVAILABLE FOR LICENSE TO NON TRENDS SUBSCRIBERS NOVEMBER, 2023.
Online with slide download, PPT & PDF (unlimited log-ins) - $28,000
Online with slide download (1-50 logs-ins) - $22,000
Online only (1-20 log-ins) - $18,000
Sample Report Pages
Methodology. 1-3
Key Findings & Implications. 4
Favorite Statistics. 5
Related Research. 6
Key Findings. 7-39
1: Nearly 130M households control $69.7T in investable assets, with growth in taxable now faster than retirement due to increasing concentration of wealth. 7-14
1.1: Exhibit 1.1 — U.S. Households (M): By Year
7
1.2: Exhibit 1.2 — U.S. Household Total Investable Assets* ($T): by Year
8
1.3: Exhibit 1.3 — Total Investable Assets by Taxable and Consumer-Controlled Retirement ($T): by Year
9
1.4: Exhibit 1.4 — Consumer-Controlled Retirement, By Account Type ($T): by Year
10
1.5: Exhibit 1.5 — Taxable Assets vs. Retirement and Retirement Components, 2022-Q4
11
1.6: Exhibit 1.6 — Components of Household Wealth ($T): by Year
12
1.7: Exhibit 1.7 — Components of Household Wealth ($T): 2022-Q4
13
1.8: Exhibit 1.8 — Pension Plans ($T) by Funding Status and Sponsoring Entity Type: 2022-Q4
14
2: Concentration of investable assets is increasing. In 2022, only 12% of total investable assets is controlled by households with <$500K, down from 23% in 2011. 15-24
2.1: Exhibit 2.1 — The Portrait Grid™ 2022
15
2.2: Exhibit 2.2 – U.S. Households and Investable Assets: by Investable Asset Groups, 2022
16
2.3: Exhibit 2.3 — The Portrait Grid™ Visualization of Number of U.S. Households (M): by Age and Investable Assets, 2022-Q4
17
2.4: Exhibit 2.4 — The Portrait Grid™ Visualization of U.S. Household Investable Assets ($B): by Age and Investable Assets, 2022
18
2.5: Exhibit 2.5 – U.S. Households and Investable Assets: by Investable Asset Groups, by Year
19
2.6: Exhibit 2.6 – 5-Year Change in U.S. Households and Investable Assets: by Investable Asset Ranges, 2022 vs. 2017
20
2.7: Exhibit 2.7 – Percent of Total Investable Assets Controlled by Households in Each Asset Range: by Year
21
2.8: Exhibit 2.8 – The Portrait Grid™ 5-Year Historical Lookback: 2022 vs. 2017
22
2.9: Exhibit 2.9 – The Portrait Grid™ 5-Year Historical Lookback at Investable Assets: 5-Year Change in U.S. Household Investable Assets ($B) by Age and Investable Assets: 2022-Q4 vs. 2017
23
2.10: Exhibit 2.10 — Asset Class Allocation to Equity, Awareness and 0% Equity: by Investable Asset Ranges, by Year
24
3: Households age 55+ control $51.4T, in part due to increasing concentration of wealth. However, among households with <$5M, Post-Retirees still dwarf all other lifestages in both asset and household terms. 25-33
3.1: Exhibit 3.1 – U.S. Households and Investable Assets by Age: 2022
25
3.2: Exhibit 3.2 – U.S. Households and Investable Assets: by Age, by Year
26
3.3: Exhibit 3.3 – U.S. Households and Investable Assets <$5M vs. $5M+ by Age, 2022
27
3.4: Exhibit 3.4 – Lifestage Composition Within Breadwinner Age Groups: 2022
28
3.5: Exhibit 3.5 – Percent of Households in Post-Retiree Lifestage, by Age/Investable Asset Groups: 2022
29
3.6: Exhibit 3.6 – U.S. Households and Investable Assets by Lifestage: 2022
30
3.7: Exhibit 3.7 – U.S. Households and Investable Assets: by Lifestage, by Year
31
3.8: Exhibit 3.8 – U.S. Households and Investable Assets by Lifestage: Excluding $5M+ and Only $5M+, 2022-Q4
32
3.9: Exhibit 3.9 — Anticipated/Actual Sources of Income in Retirement - Employment Income: Incidence Rate and Average Percent of Income, by Lifestage, by Investable Asset Groups, 2022
33
4: The Wealth Market $2M+ of 5.5M households with $45.3T can be understood in 3 segments ($2M-<$5M Retired, $2M-<$5M Not Retired, $5M+) with differing attitudes and behaviors. 34-39
4.1: Exhibit 4.1 – Consumer Segment and Design Target Sizing: Wealth Market $2M+
34
4.2: Exhibit 4.2 — Profile of Wealth Market Segments: Demographics
35
4.3: Exhibit 4.3 — Profile of Wealth Market Segments: Household Finance and Attitudes & Sentiment
36
4.4: Exhibit 4.4 — Profile of Wealth Market Segments: Attitudes & Sentiment (cont.) and Paint Points & Actions
37
4.5: Exhibit 4.5 — Profile of Wealth Market Segments: Advice & Technology
38
4.6: Exhibit 4.6 — Profile of Wealth Market Segments: Wants & Pricing and Investment Products & Asset Managers
39
Appendix. 40-41
Glossary. 42
View Related Briefing. 43
Name:
Email:
Company:
Phone:
Signature:
Date: