Investment ProductsGrowth in Awareness, Online Trading, Use of Robos and How Managed Solutions Help Investors Cope With Volatility
Growth in Awareness, Online Trading, Use of Robos and How Managed Solutions Help Investors Cope With Volatility
Order Report -
Report Overview
Ownership of managed investment solutions including mutual funds, ETFs and robos grew in the past year. Does this mean investors are now seeking more professional investment management vs. relying on doing it themselves - especially given the current state of the market? Possibly, but individual stocks are now the most widely owned investment type, and trading activity spiked in the past year. This report explores both of these trends in detail, including which segments are driving each, and where the opportunities lie for asset managers, distributors and brokerage firms. Additionally, given the current market volatility, we have included a special section on how managed solutions help investors cope with handling market volatility.
Key Findings
- Consumer awareness of the investment products they own is on the upswing, especially for mass market households.
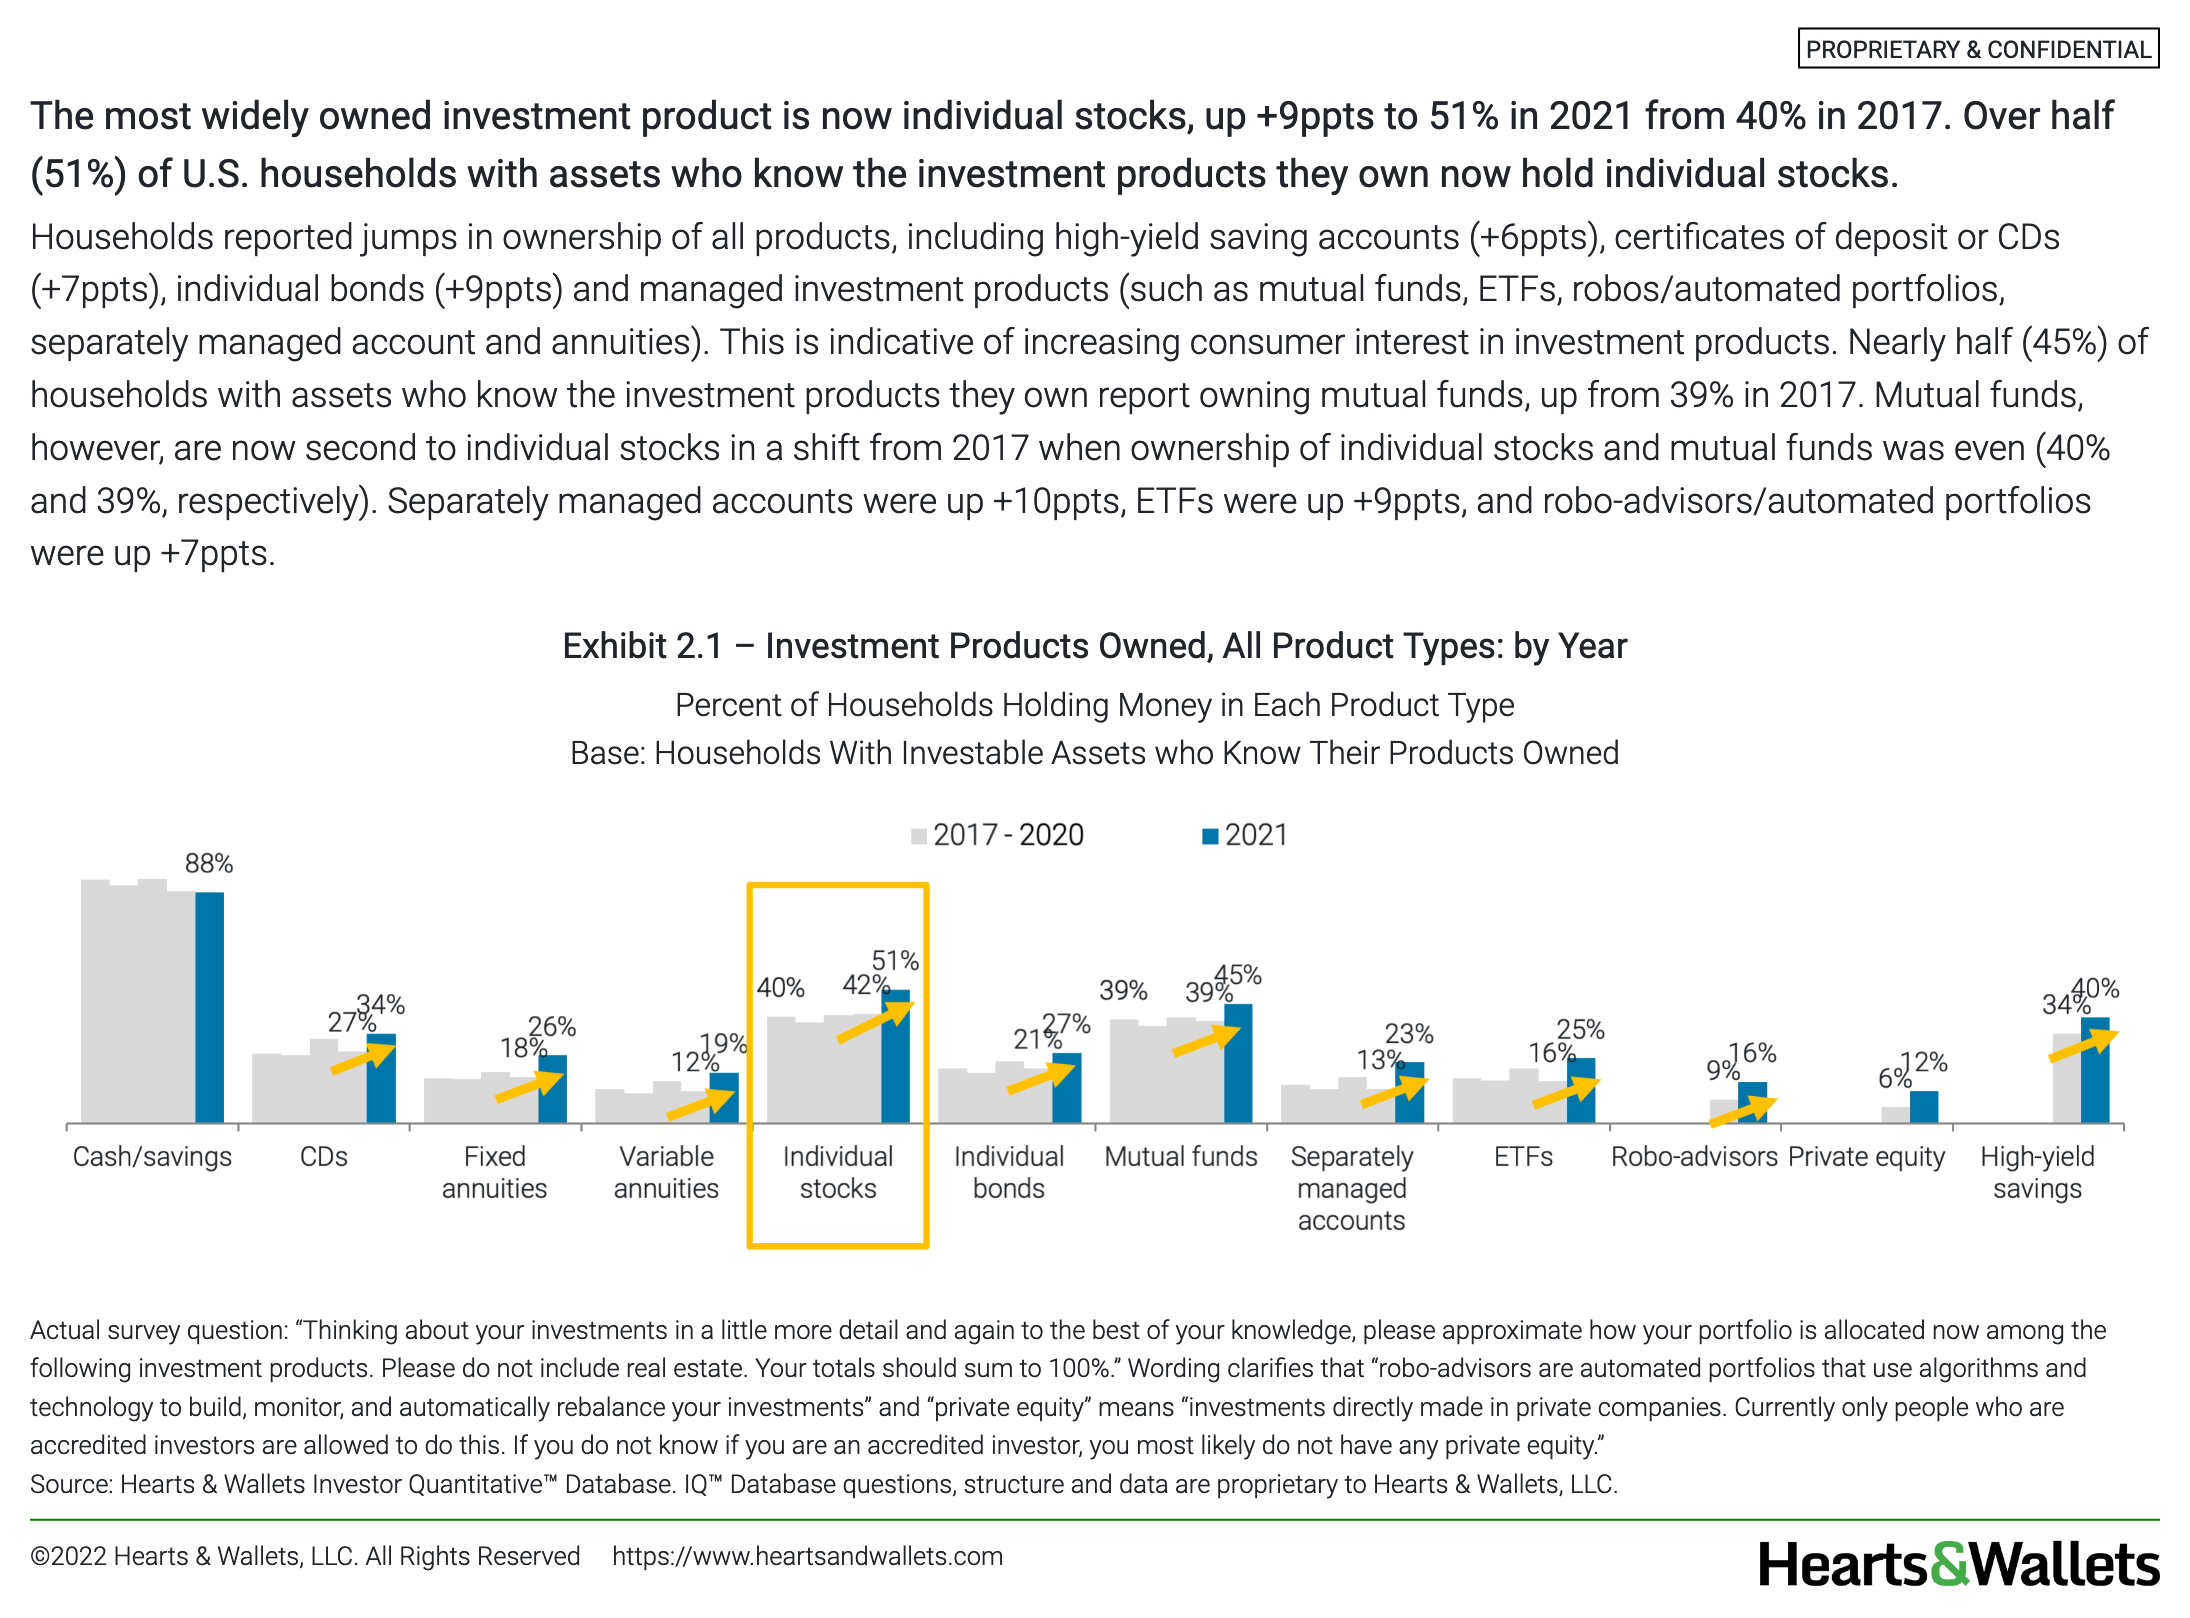
- Individual stocks are now the most widely owned investment product, but ownership of managed solutions grew, with a big increase in consumer interest in the managers behind the funds.
- Online brokerage (OLB) penetration jumped to nearly half (47%) of U.S. households. Trading activity spiked.
- Women report lower OLB ownership and trading activity than men, but younger women and married/partnered women are getting more engaged in stock trading.
- Use of robos/automated portfolios doubled year over year to at least 13M households, and possibly as many as 18M.
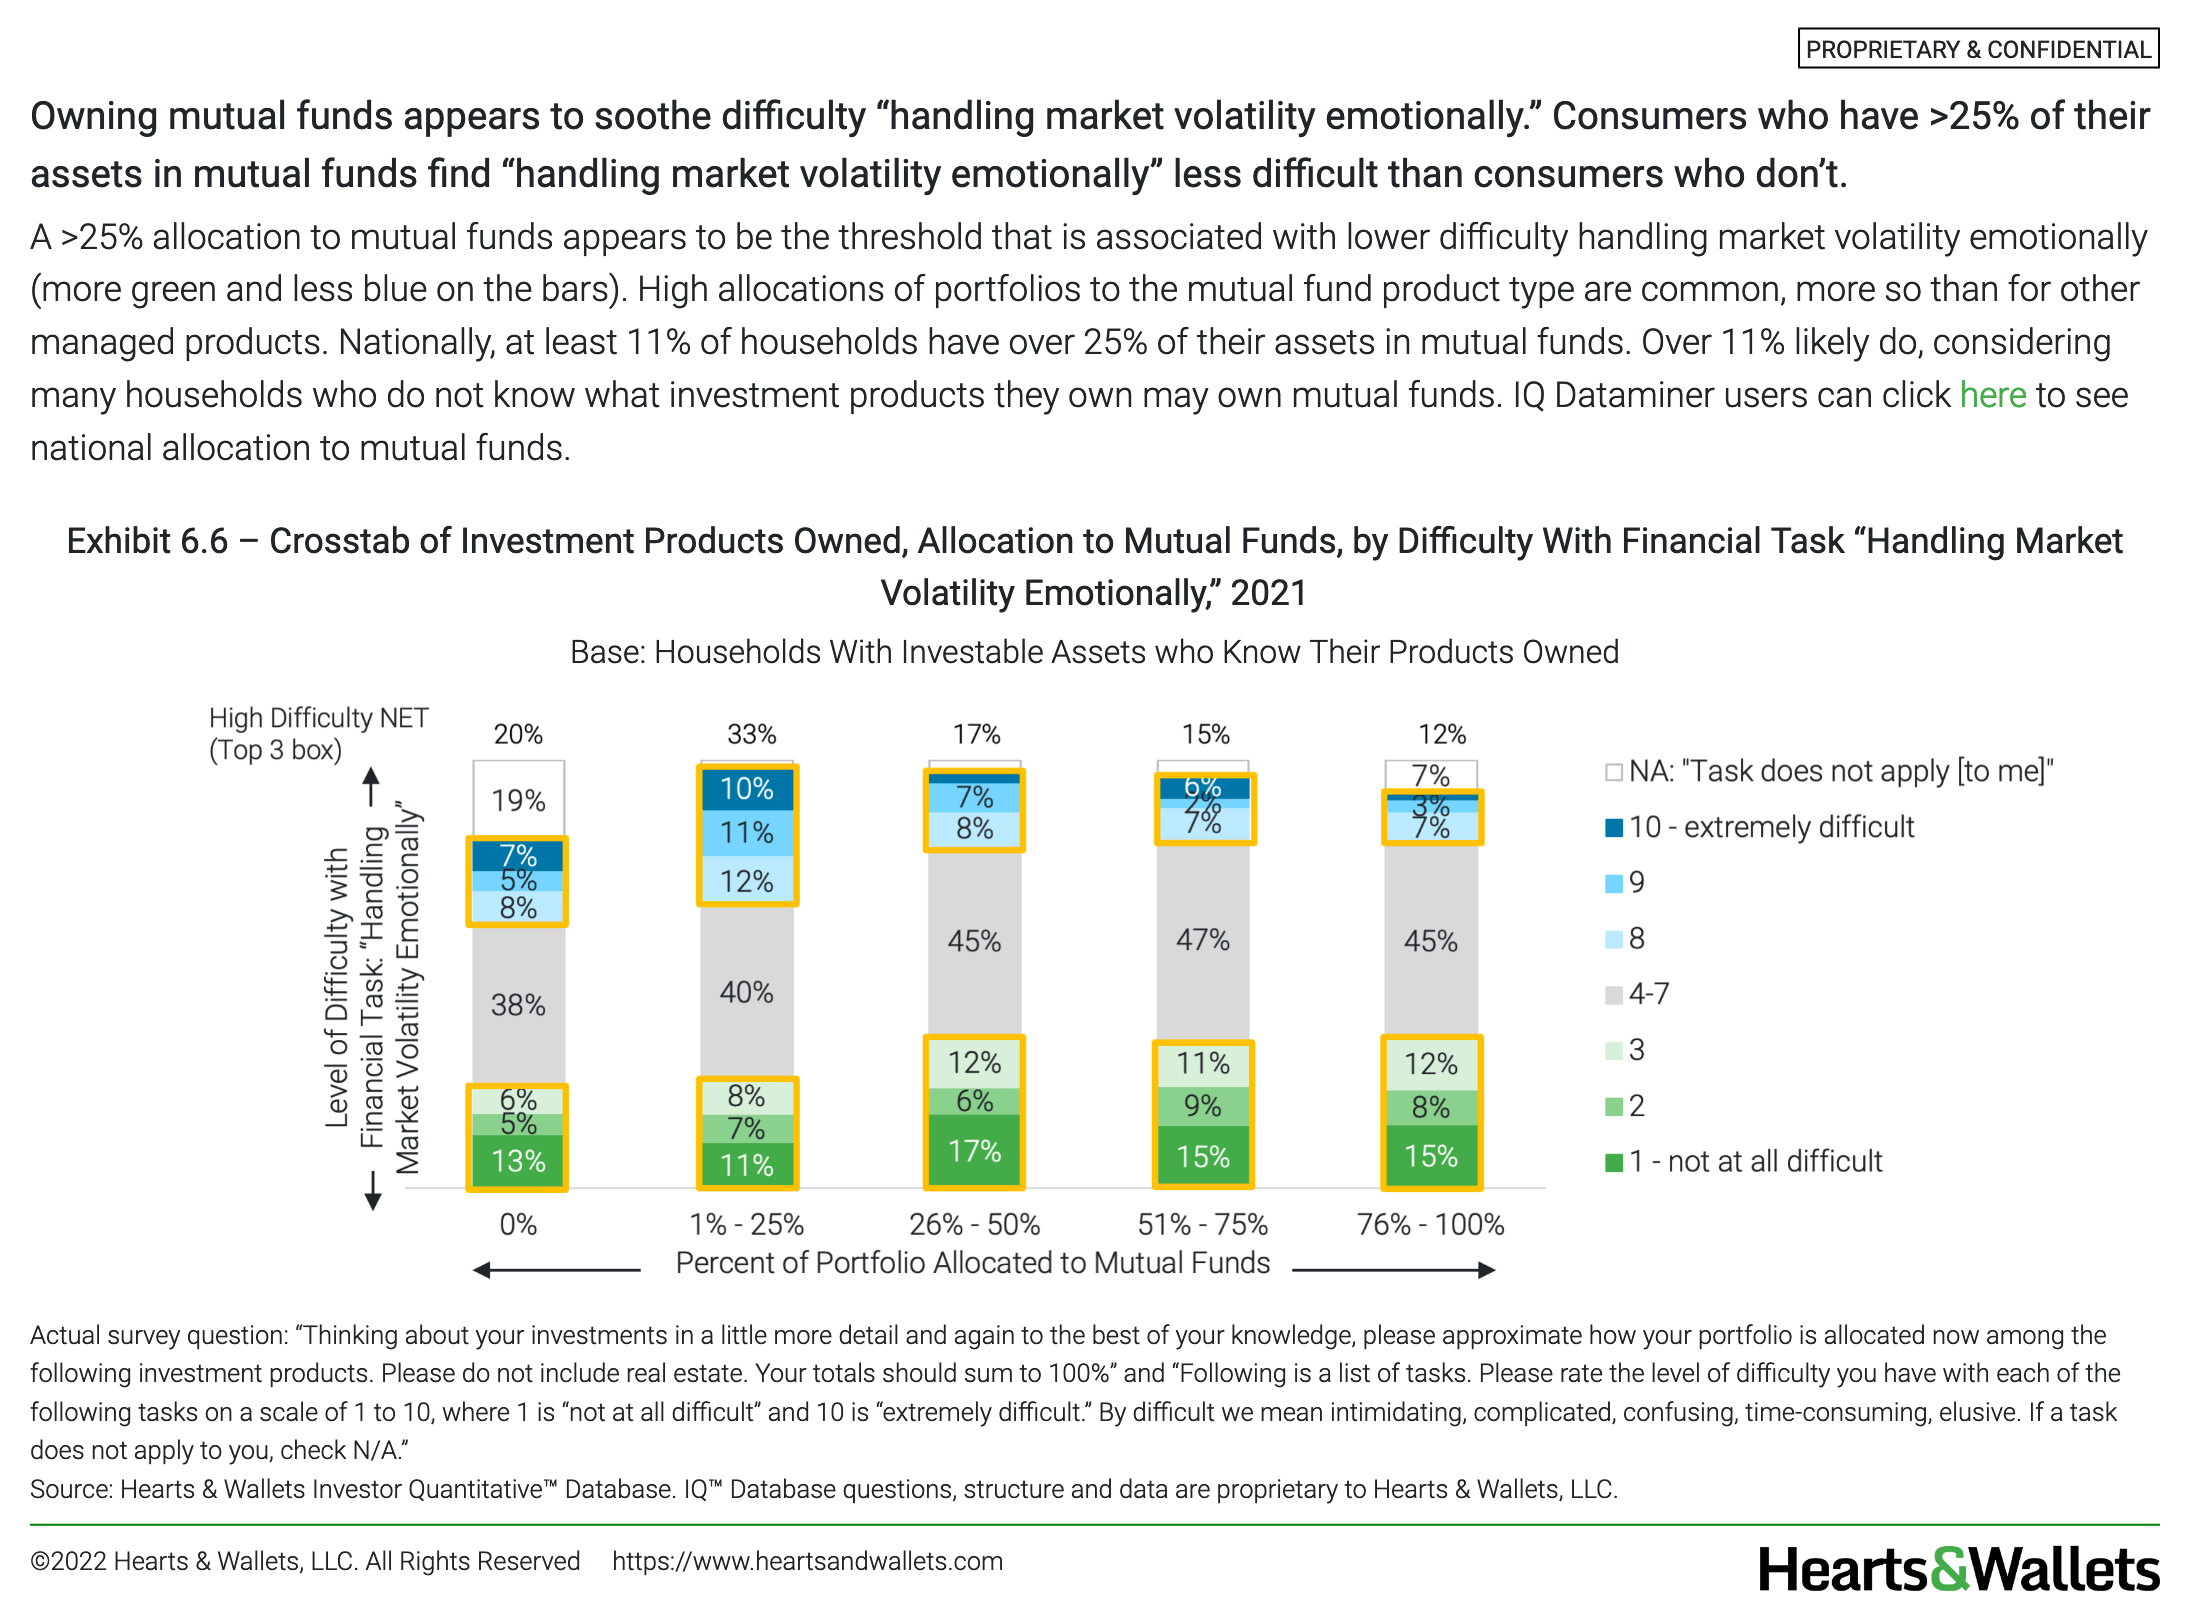
- Owning mutual funds appears to help consumers ”handle market volatility emotionally,” but robos do not.
Pricing
Choose access licenses for your team or organization in ways that support how you collaborate. AVAILABLE FOR LICENSE TO NON TRENDS SUBSCRIBERS June 16, 2022.
Online only (1-20 log-ins) - $6,000
Online with slide download (1-50 logs-ins) - $9,500
Online with slide download, PPT & PDF (unlimited log-ins) - $15,000
Sample Report Pages